From UX page to formatted Sheet
Navigate the app → category → page tree, select a combined grid, and choose account hierarchy levels. See Time and Executive Owner linked automatically, then compare source headers, variance colors, number formats and commentary with the exported sample Sheet.
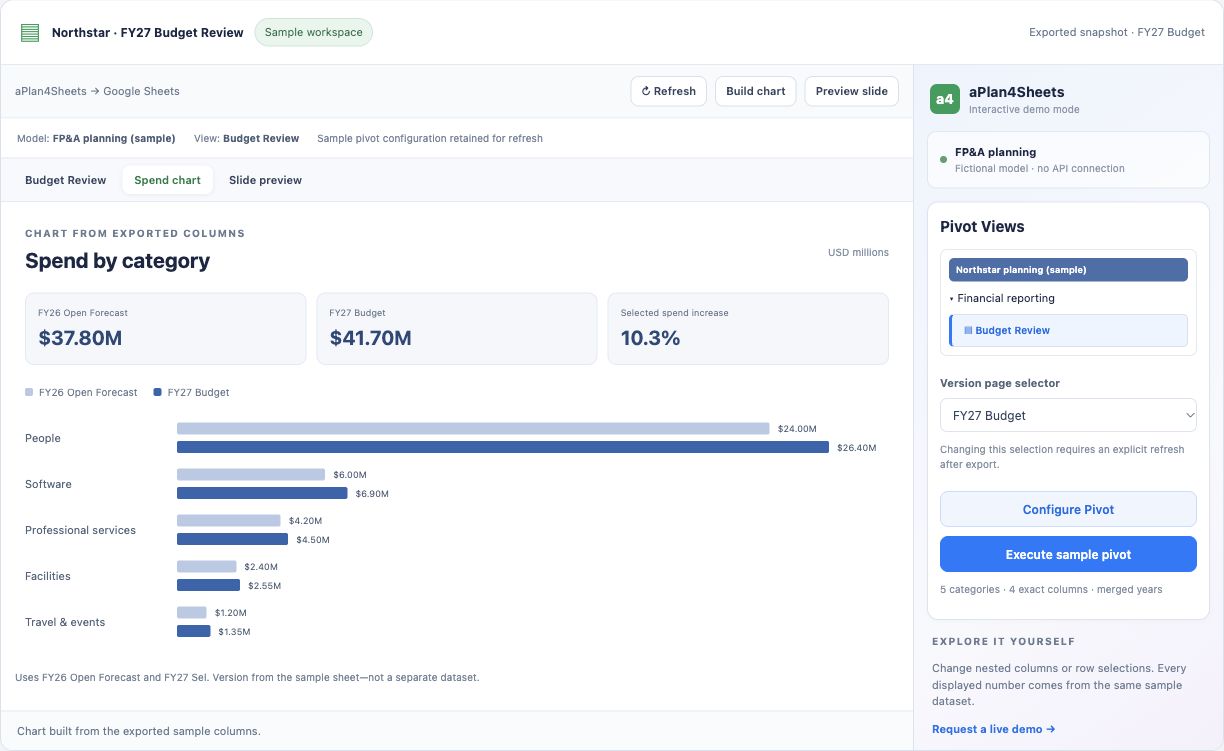
From source view to budget review
Choose exact year/measure combinations and expense rows, populate a sample pivot, and build a chart. Switch to Q4 Forecast and refresh to see the sheet, chart, and illustrative slide reconcile. Fictional data; no sign-in or customer-model access.
Nested Selections
New · interactive + narratedSelect exact occurrences across two or three nested dimensions. Keep different measures under each year, preview the result, and merge repeated outer headers.
Getting Connected
Narrated walkthroughSee how to install the add-on, connect to Anaplan via OAuth/SSO, and configure your first model — with a guided connection flow.
Pivot Views
Narrated walkthroughBuild custom pivot views from any Anaplan module. Drag dimensions, select items, filter, and execute — write the selected layout into Google Sheets.
Multi-Module Pivots
Narrated walkthroughCombine data from multiple Anaplan modules side-by-side in a single sheet. Link pivots together so changing a page filter in one syncs the same period or version across the whole reporting pack.
Scheduled Refresh
Narrated walkthroughSet up automatic hourly, daily, or weekly refreshes. Your Anaplan data stays current without manual intervention.
Formatted UX Pages
Narrated walkthroughBrowse the apps, categories, and pages in your model's Anaplan UX. Pull grid widgets — including combined grids that span multiple modules — into Sheets with the source UX formatting intact.
UX Board Formatting
Narrated walkthroughImport Anaplan board formatting into Google Sheets. Hierarchy styles, number formats, and summary rows are applied automatically.
AI Analyst
Narrated walkthroughFollow an illustrative analysis: ask a question, review findings, explicitly export to Sheets, and prepare a narrative. Claude handoffs are a separately configured pilot.
OAuth Setup
Narrated walkthroughWalk through the full OAuth setup wizard — from IT admin credential entry to connection verification and first login.